13.1.7. The histogram
Below the frame buffer viewer, the histogram pane plots the distribution of pixel values in the current frame – or, when a region is selected in the frame buffer, in just that region. It updates live with the preview, which makes it the instrument for the questions that come up constantly in machine vision work: what colour is that object numerically, how much does it vary, and how does it separate from the background.
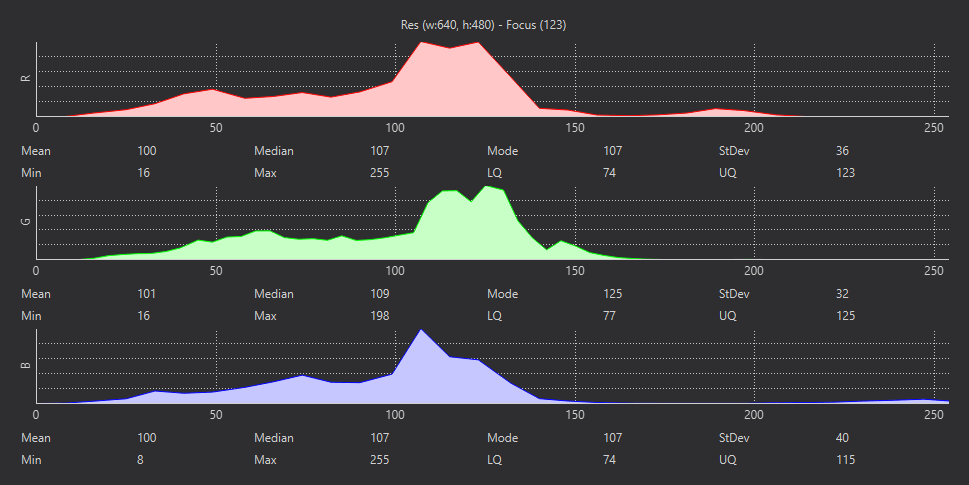
The histogram in RGB: one plot per channel with its statistics underneath. The readout line on top ends with the focus number.
The selector in the pane’s title bar chooses the colour space the statistics are computed in: RGB, Grayscale, LAB, or YUV. Match it to what your script will use. A script tracking colour blobs with find_blobs() thresholds in LAB, so read the object’s values in LAB; a script thresholding brightness works in grayscale. Each channel gets its own plot, with the channel’s statistics underneath: mean, median, mode, standard deviation, minimum, maximum, and the lower and upper quartiles.
The everyday use is threshold hunting. Select the target object in the frame buffer, switch to the matching colour space, and read off where its pixels actually sit – the min / max of each channel are a first draft of a threshold tuple, and the quartiles show where the bulk of the distribution is when the extremes are outliers. The threshold editor builds on the same data interactively.
13.1.7.1. The focus number
The readout line above the histogram ends with a focus metric – a sharpness score computed from the image. Its absolute value means nothing; its direction means everything. While adjusting a lens, watch the number: it rises as the image gets sharper and peaks at best focus. Point the camera at a detailed target at the working distance, turn the lens slowly, and stop at the maximum.