
 OpenMV MicroPython
 13.2.4. The histogram#
Below the frame buffer viewer, the histogram plots the distribution of pixel values in the current frame – or, when a region is selected in the frame buffer, in just that region. It updates live with the preview, so you can read what the camera sees numerically: what colour an object is, how much it varies, and how it separates from the background.
The histogram is one of five views the pane can show; the selector at the left of its title bar switches between them. Board Info lists what the connected camera is – board, sensor, firmware and bootloader versions, memory sizes, and capabilities – which is the information to quote in a support request. Memory graphs the camera’s memory use while the script runs. Statistics counts the packets, errors, and channel events on the link to the camera, for diagnosing a connection that misbehaves. Channels shows the readouts and controls the product’s script publishes, covered on its own page. The IDE’s pane views page describes each in more detail.
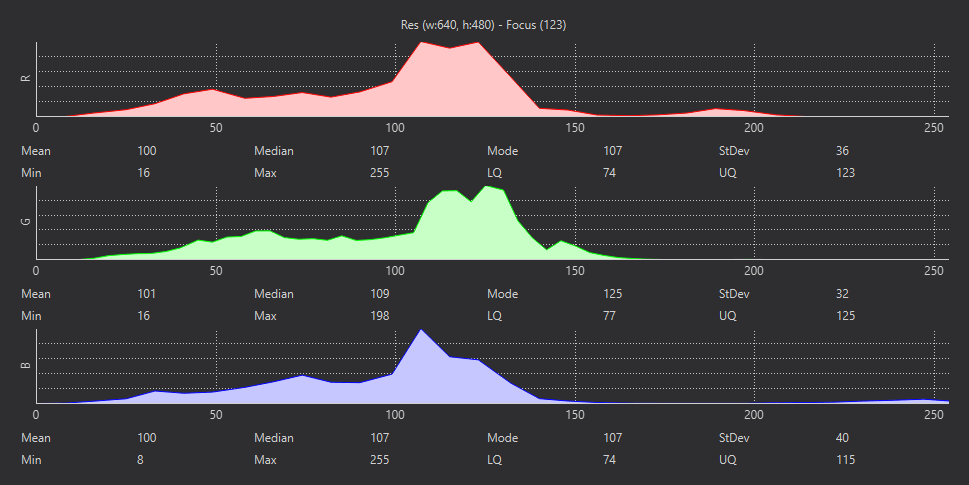
The histogram in RGB: one plot per channel with its statistics underneath.#
The selector in the pane’s title bar chooses the colour space the statistics are computed in: RGB, Grayscale, LAB, or YUV. Each channel gets its own plot, with the channel’s statistics underneath: mean, median, mode, standard deviation, minimum, maximum, and the lower and upper quartiles. Select a region in the frame buffer to read the values of one object instead of the whole scene.
13.2.4.1. The focus number#
The frame buffer’s title line ends with a focus metric – a sharpness score computed from the image. Its absolute value means nothing; its direction means everything. While adjusting a lens, watch the number: it rises as the image gets sharper and peaks at best focus. Point the camera at a detailed target at the working distance, turn the lens slowly, and stop at the maximum.