
 OpenMV MicroPython
 13.2.5. The Channels view#
A product’s script can publish named values and controls over the debug protocol – a reading, a detection count, a microphone waveform, a depth map, a switch or a threshold the operator may change – and the Channels view, selected from the pane below the frame buffer, shows them live. Readouts and controls appear as labels, toggles, sliders, spin boxes, radio buttons, selectors, text fields, and buttons; changing a control sends the new value to the script. Waveforms appear as scrolling graphs, with a spectrum mode and triggers; depth maps appear as false-colour images with a choice of palette, scaling, and tone mapping. Any graph or map can be recorded to a CSV, WAV, NumPy, or Edge Impulse file, and the last values stay on screen when the script stops.
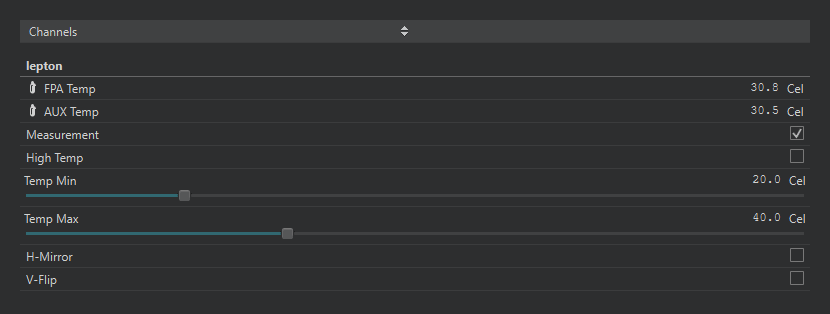
A thermal camera script’s controls as the Channels view renders them.#
The view is the same one OpenMV IDE has; its Channels view page covers every control, the graph and map tools, and recording in detail.